|
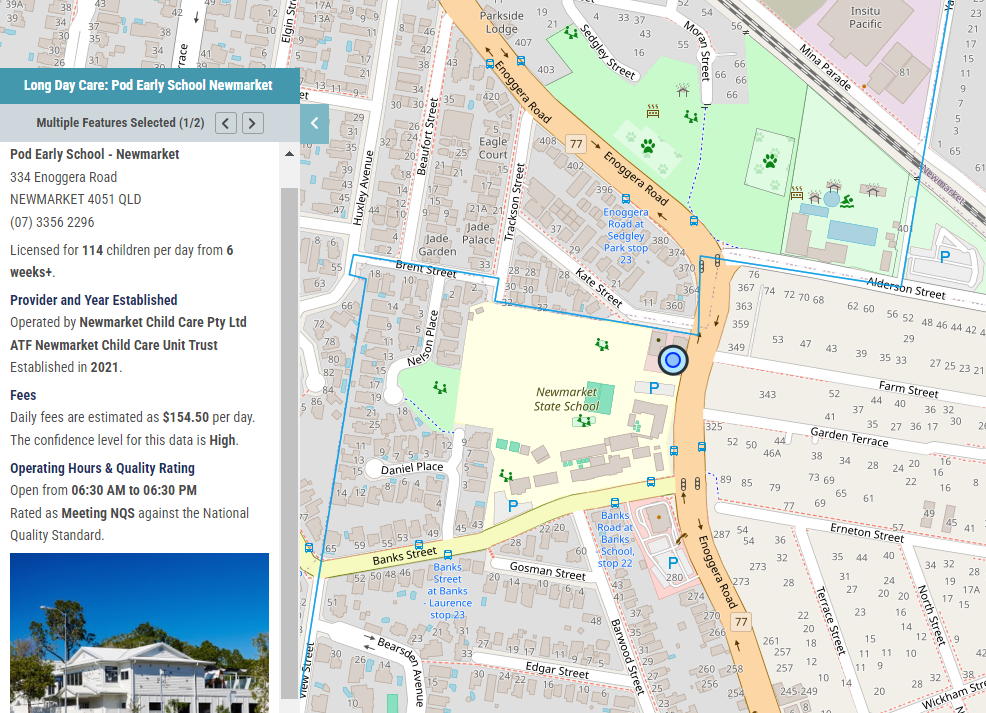
Access detailed Childcare InformationQikmaps for Childcare provides instant online access to Business Geographics’ curated national database of long day care centres and can be used to conduct a quick desktop appraisal of prospective sites.
Detailed information for existing centres is provided, including: location, size, age, provider, quality rating, fees* and a photo (where available). The data is constantly updated in line with our ongoing research program. *Fees not included in LITE version. |
|
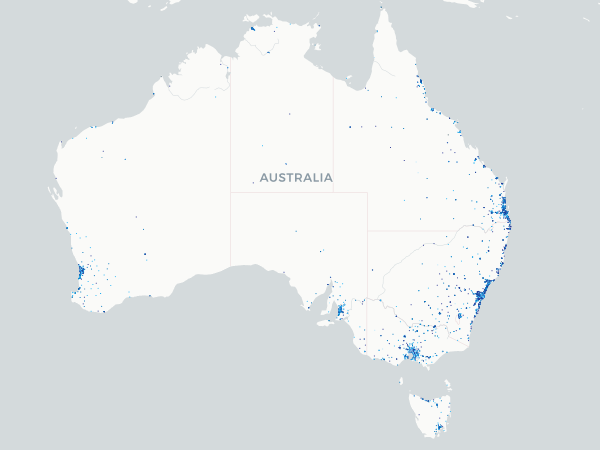
Australia-wide DataSearch for any address or long day care centre in Australia.
Qikmaps requires only a browser and internet connection to use and can be accessed from any PC, laptop or mobile device. From Albury to Zilmere, Qikmaps has you covered. |
|
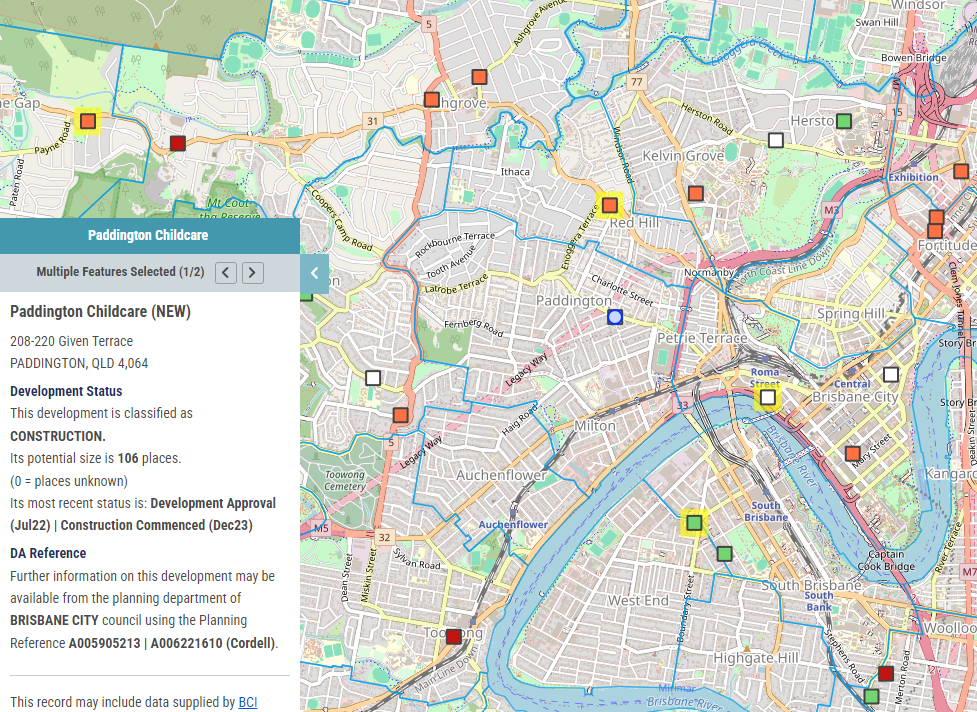
Childcare Development PipelineAustralia's childcare landscape is constantly changing, with new centres opening all the time. Stay ahead of the game, with access to proposed child care centre developments.
Qikmaps for Childcare provides details of the location, development status, and number of places for a curated database of childcare centre development sites throughout Australia. This data is compiled from local government planning registers and includes data from construction project lead services provided by BCI Australia (Lead Manager) and RP Data (Cordell Connect). |
|
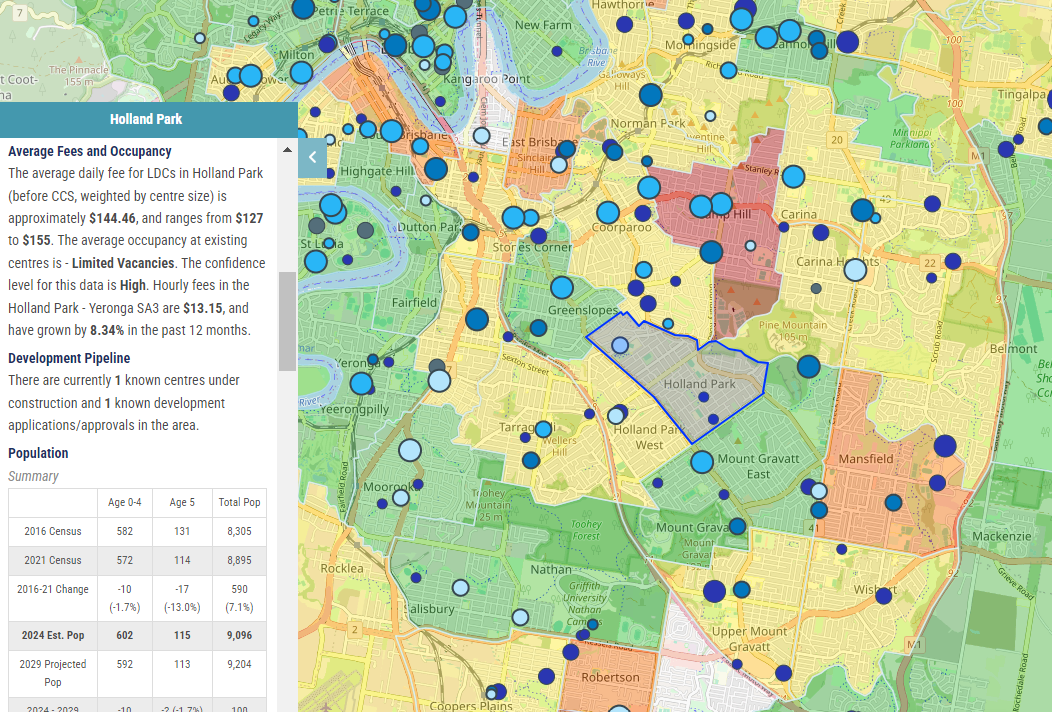
Average Fees and Occupancy by Area*Qikmaps for Childcare includes Average Daily Fees and Occupancy by Statistical Area 2 (SA2) across Australia.
Quickly identify which areas have the highest or lowest fees and occupancy and where childcare availability is most or least accessible. Explore the market to find opportunities for centre acquisition or development. *Fees and Occupancy by area not included in LITE version. |
|
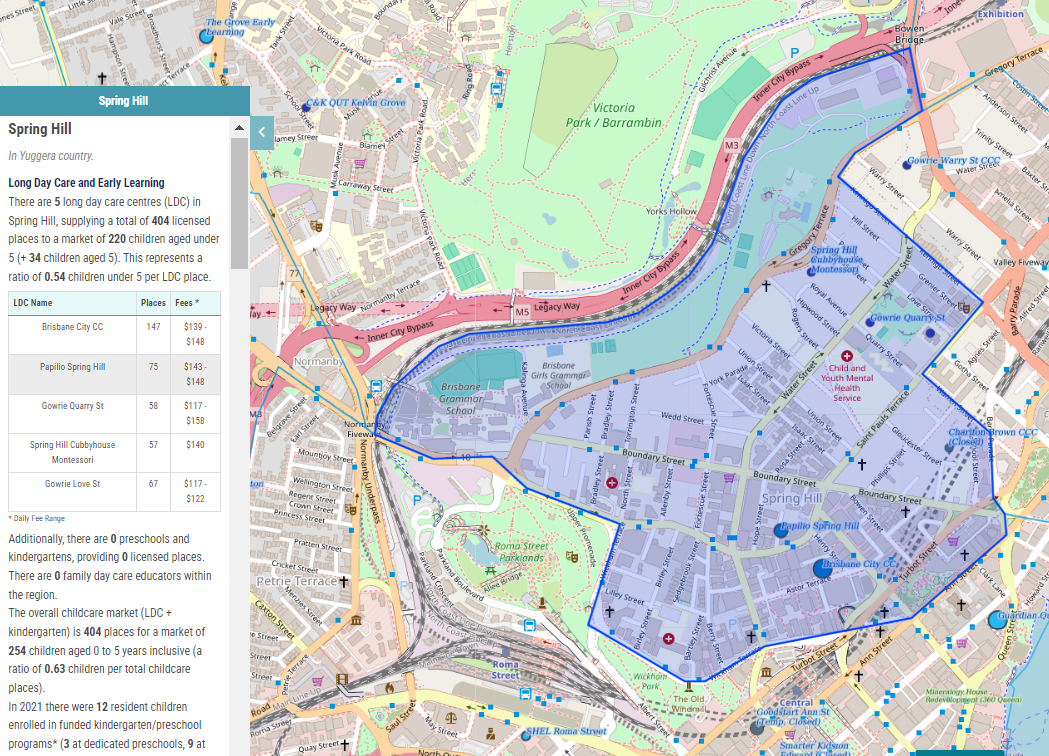
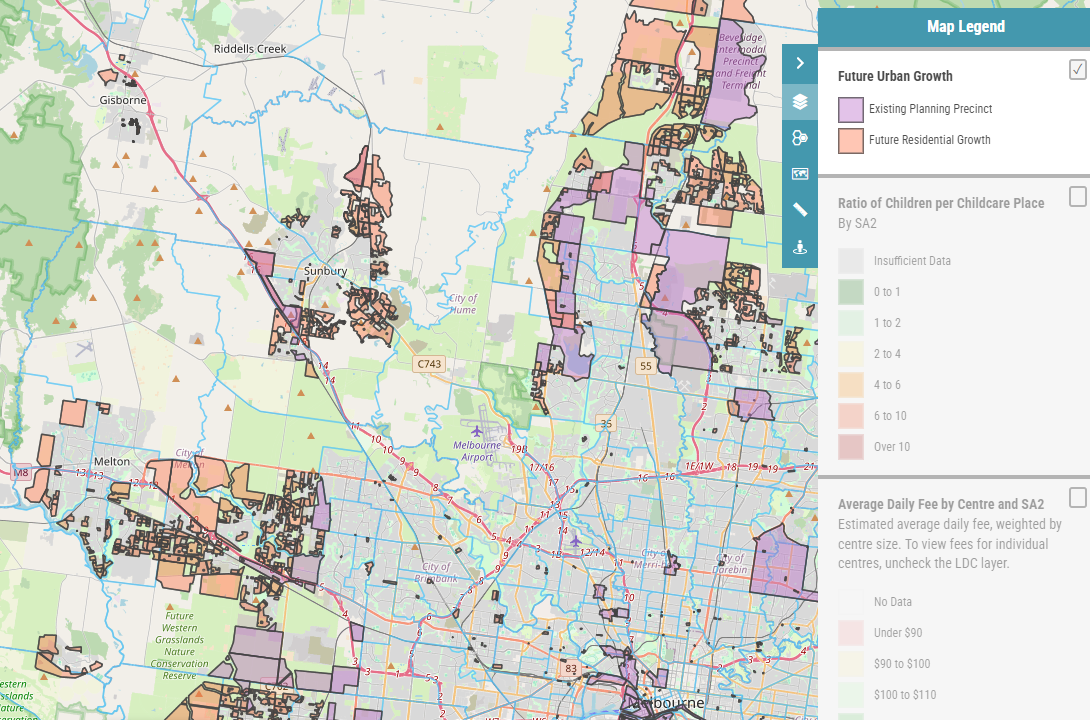
Detailed Demographic Statistics and MapsAccess the latest demographic data by Area.
Qikmaps for Childcare provides detailed demographic information, demand drivers, and population growth areas across Australia. Data provided includes population characteristics, the number of children under 5, socio-economic status and the female labour force. Maps showing the Ratio of Children per Childcare Place, Population Growth Rates, the distribution of children under 5, and socio-economic status are also available at the click of a mouse. |
|
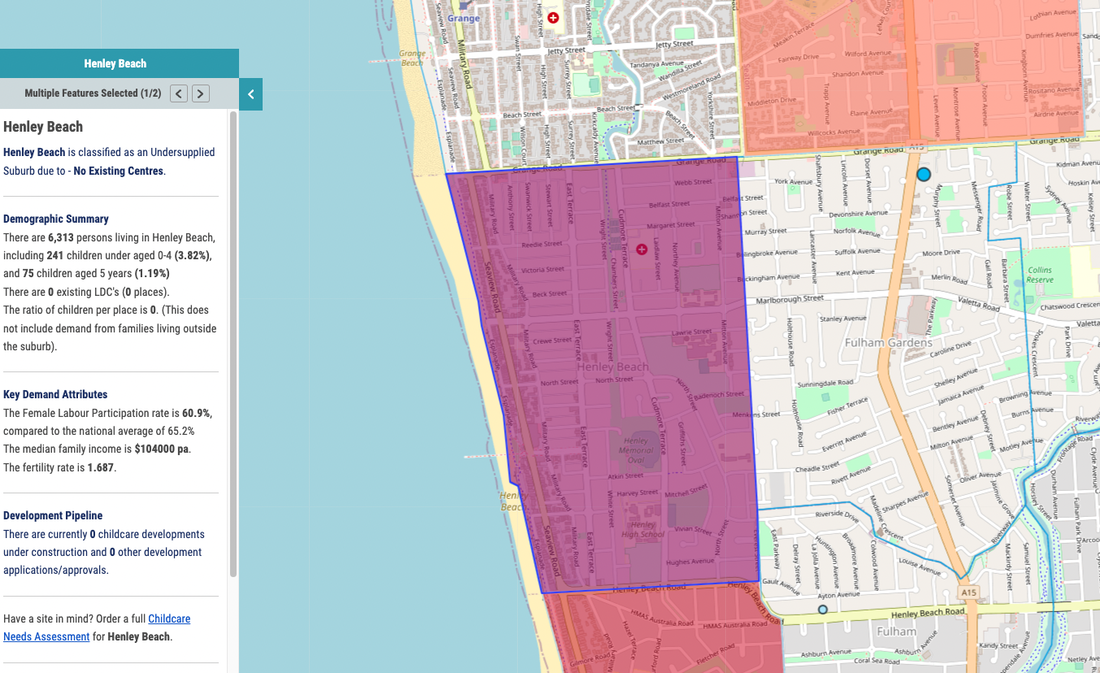
View Undersupplied Suburbs and Create Custom Reports*Parents want childcare that's convenient, and close to where they live or work. The undersupplied suburbs map shows areas with limited or no childcare supply.
Or if you already have a location in mind, use the custom catchment report to display statistics for the surrounding area. Custom Catchment Tool - Retrieve data for user-defined custom catchment areas. *Undersupplied Suburbs, Custom Catchment Reports and Data Downloads are not included in LITE version. |
|
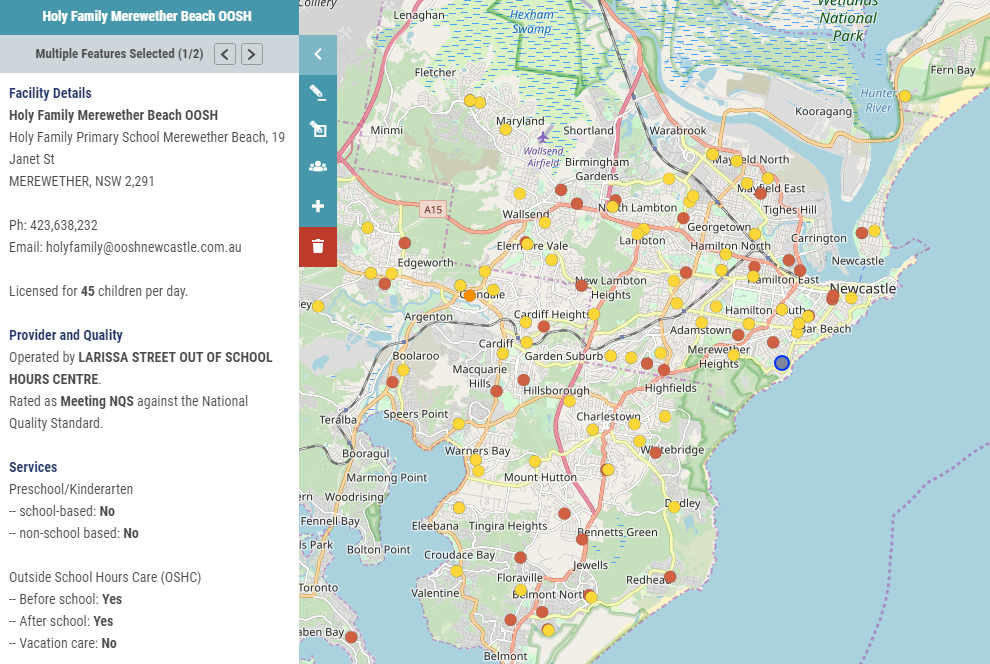
Other Childcare FacilitiesQikmaps also includes access to data on registered preschools, kindergartens, and Outside School Hours Care (OSHC) facilities.
|
|
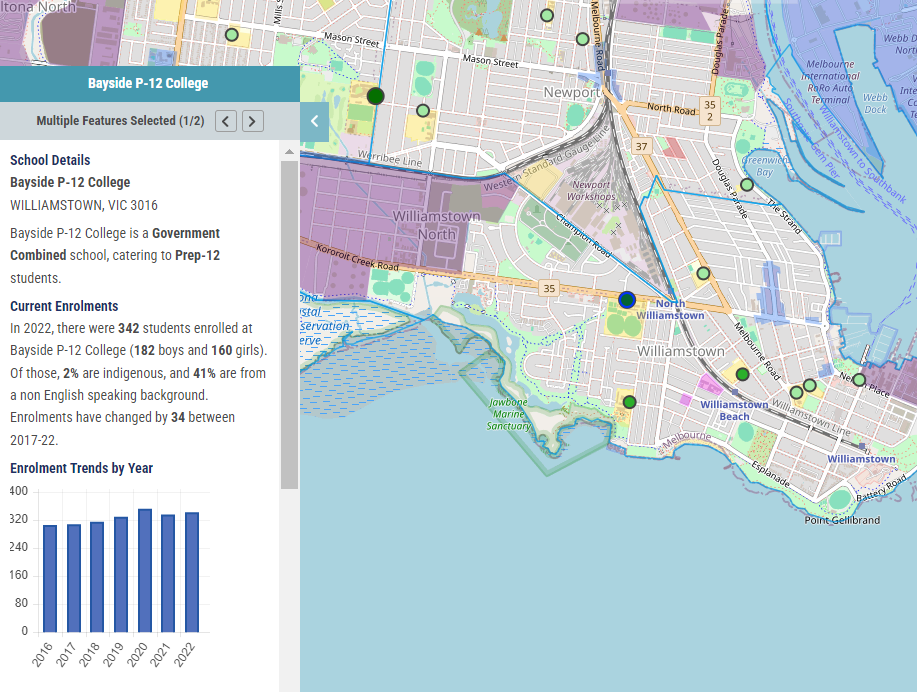
School Locations and Enrolment TrendsThere are strong synergies between schools and childcare. Families like to live near high-quality schools, and dropping older children at school is part of most parents' daily commute.
With school locations and enrolment trends you can analyse how local schools are performing and identify opportunities near busy or growing schools. |
|
Simple to Use and Updated WeeklyQikmaps for Childcare provides a simple, point-and-click user interface, and runs in your web browser. There is no complicated software to install or learn.
Qikmaps requires only a browser and internet connection to use and can be accessed from any PC, laptop or mobile device. Key datasets including the Long Day Care Database and Development Pipeline are updated Weekly. |
Comparison of Qikmaps for Childcare Features:
Qikmaps LDC Features * = not included in LITE Version |
LITE Version |
Full Version |
Long Day Care Centres |
LITE Version |
Full Version |
Centre location by Size and Age |
✅ |
✅ |
Name, Address, Phone Number |
✅ |
✅ |
Licensed Places |
✅ |
✅ |
Provider and Year Established |
✅ |
✅ |
Centre Fees* |
❌ |
✅ |
Operating Hours & Quality Rating |
✅ |
✅ |
Photo (Where Available) |
✅ |
✅ |
Childcare Development Sites |
LITE Version |
Full Version |
Location by Status |
✅ |
✅ |
Name and Address |
✅ |
✅ |
Development Status |
✅ |
✅ |
Proposed Size (Where Known) |
✅ |
✅ |
Council DA Reference |
✅ |
✅ |
Developments added or updated in the last 30 days (Map) |
✅ |
✅ |
Other Childcare |
LITE Version |
Full Version |
Location and Details of Preschools/Kindergartens, OSHC |
✅ |
✅ |
Family Day Care (Head Office Locations) |
✅ |
✅ |
Schools |
LITE Version |
Full Version |
Current Enrolments and Trends |
✅ |
✅ |
Change in School Enrolments (Map) |
✅ |
✅ |
Vehicle Traffic |
LITE Version |
Full Version |
Vehicle Traffic Counts* |
❌ |
✅ |
Demand Generators |
LITE Version |
Full Version |
Map of key demand drivers (Employment, Education and Residential Growth Areas) |
✅ |
✅ |
Future Urban Growth |
LITE Version |
Full Version |
Map of Planning Precincts and Future Residential Growth* |
❌ |
✅ |
Thematic Map Layers |
LITE Version |
Full Version |
Ratio of Children per Childcare Place by SA2 |
✅ |
✅ |
Average Daily Fee by Centre and SA2* |
❌ |
✅ |
Average Annual Occupancy by SA2* |
❌ |
✅ |
Number of Children Aged 0 - 4 by SA1 |
✅ |
✅ |
Annual Population Change by SA1 |
✅ |
✅ |
SEIFA Quantile by SA1 |
✅ |
✅ |
Undersupplied Suburbs* |
❌ |
✅ |
Statistics by SA2 |
LITE Version |
Full Version |
Long Day Care and Early Learning |
✅ |
✅ |
Average Fees and Occupancy* |
❌ |
✅ |
Development Pipeline |
✅ |
✅ |
Population (Current, Historic and Forecast) |
✅ |
✅ |
Workers and Employment |
✅ |
✅ |
Socio-Economic Status |
✅ |
✅ |
Data Downloads & Reports |
LITE Version |
Full Version |
Generate reports for custom areas* |
❌ |
✅ |
Download the Childcare Ratio by SA2* |
❌ |
✅ |
Download a list of Long Day Care centres* |
❌ |
✅ |
Other Features and Benefits |
LITE Version |
Full Version |
24-hour on-demand access |
✅ |
✅ |
Weekly Updates |
✅ |
✅ |
Up to 3 users per subscription* |
❌ 1 user only |
✅ |
10% discount on Childcare Needs Assessments* |
❌ |
✅ |
Choose a plan that suits you and your business
Casual
|
Full
|
LITE
|